"Jacob Kettner: Why Good Agencies Fail (Operational and Financial Systems)"
Jacob Kettner of First Rank SEO walks through the financial models behind a 30-person, $3.17M agency: the hiring valley, the six revenue buckets, the three profit killers, and the utilization tax.
On this page
- Main takeaways
- Key points
- Agency profile
- Solo time allocation
- The hiring valley
- The overhead-hire break
- Pricing formula by size
- Four options when pricing structure is wrong
- The ship mechanic and value-based pricing
- The six buckets
- Pricing rule
- Three profit killers
- Real-world disaster numbers
- Utilization tax and small-team math
- The leadership reframe
- The toolkit architecture
- Three sample views from the model
- Implementation order
- Slides
- Source
Jacob Kettner, founder of First Rank SEO (a 30-person agency in Manitoba, Canada that did $3.17M last year across roughly 97 clients at 90% recurring revenue), gave a deck-only session on the operational and financial systems he built from scratch. His thesis: good agencies fail not because they are bad at SEO but because they fly blind on their own numbers. The talk covers why solo pricing slowly kills you as you grow, the hiring "valley," the six buckets every price must cover, the three profit killers that look identical on the P&L, and the utilization-tax math behind why small teams structurally bleed. He closes by reframing the whole finance apparatus as a leadership tool and gives away a five-spreadsheet toolkit. (Deck only; no recording.)
Main takeaways
-
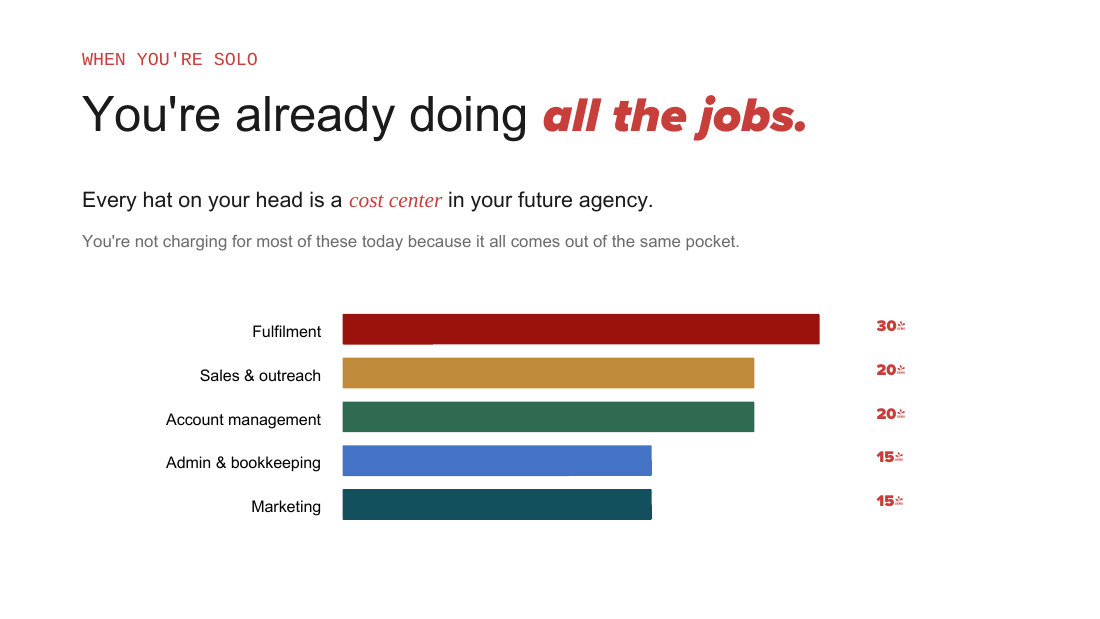
Solopreneur pricing is correct for a solo but slowly kills you as you grow. At 80 to 90% margins charging $100 to $200/hr, your only cost is tools, but every hat you wear (fulfilment, sales, account management, admin, marketing) becomes a paid cost center later that the old pricing never accounted for.
-
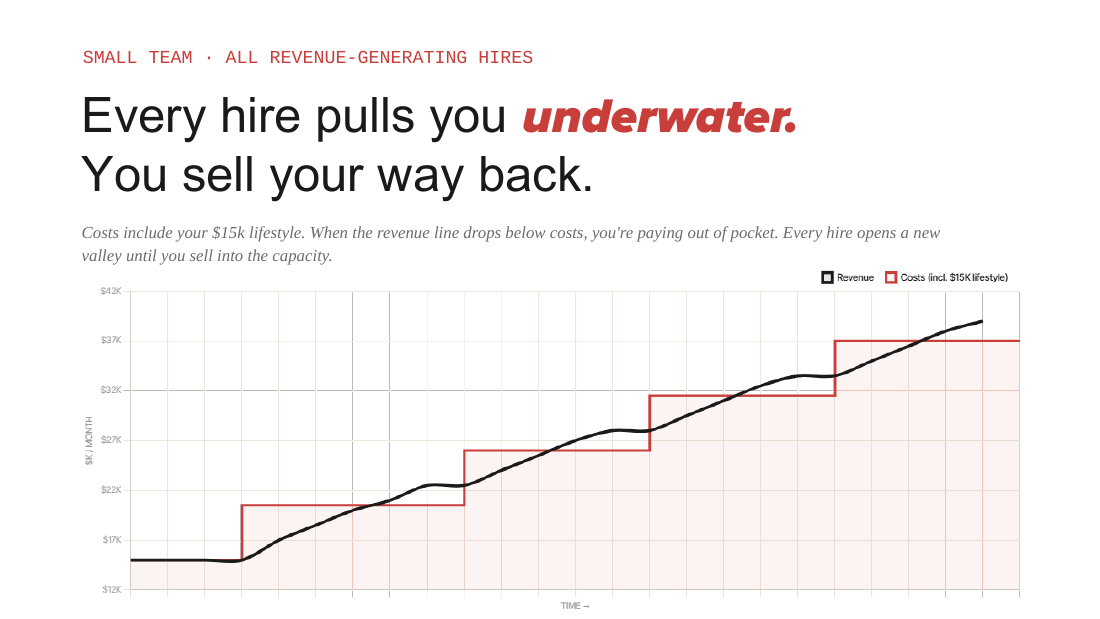
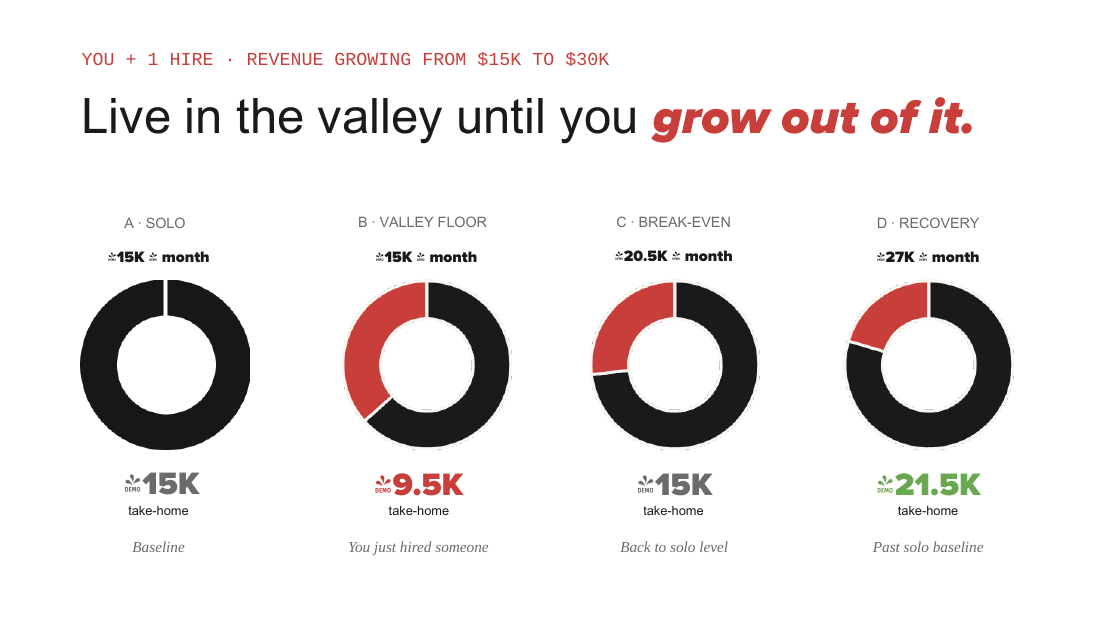
Every hire pulls you underwater and you sell your way back out. A first hire costs about $5,500/month fully loaded, but revenue does not jump, so you take a roughly 37% pay cut to the valley floor ($9.5K take-home on $15K revenue) until you sell into break-even ($20.5K) and then surplus ($27K). Most agencies panic in the valley and undo the hire or drop prices.
-
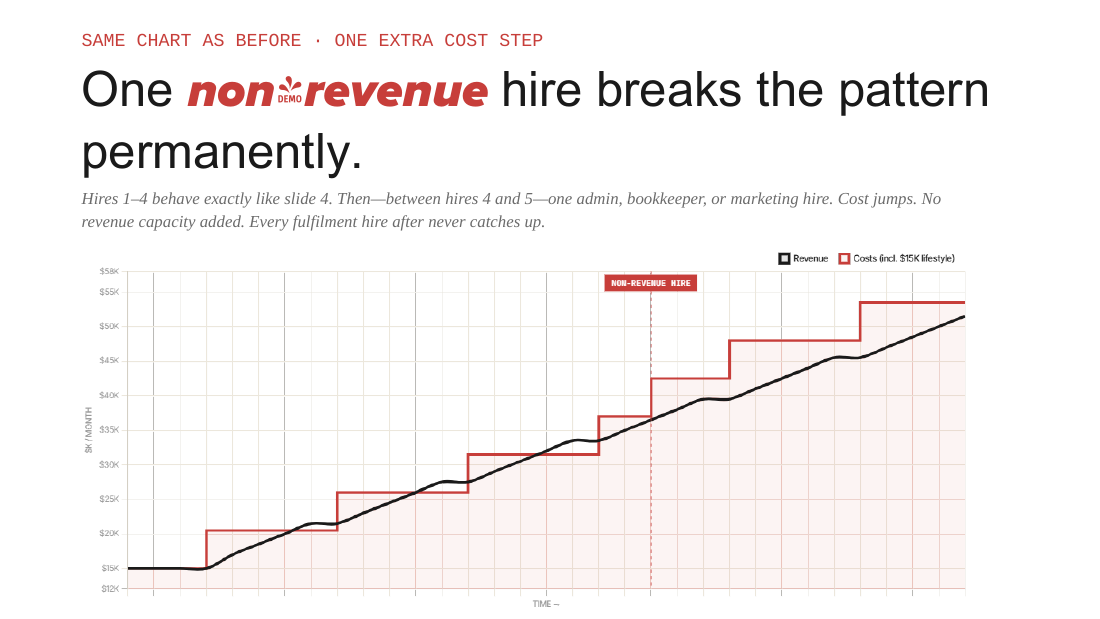
One non-revenue hire breaks the margin pattern permanently. An admin, bookkeeper, marketing, or sales hire steps cost up $5,500 with zero new sellable capacity, so every fulfilment hire after it never fully catches up. This is how agencies that look healthy on the top line quietly bleed on the bottom line, and nobody can name the moment it broke.
-
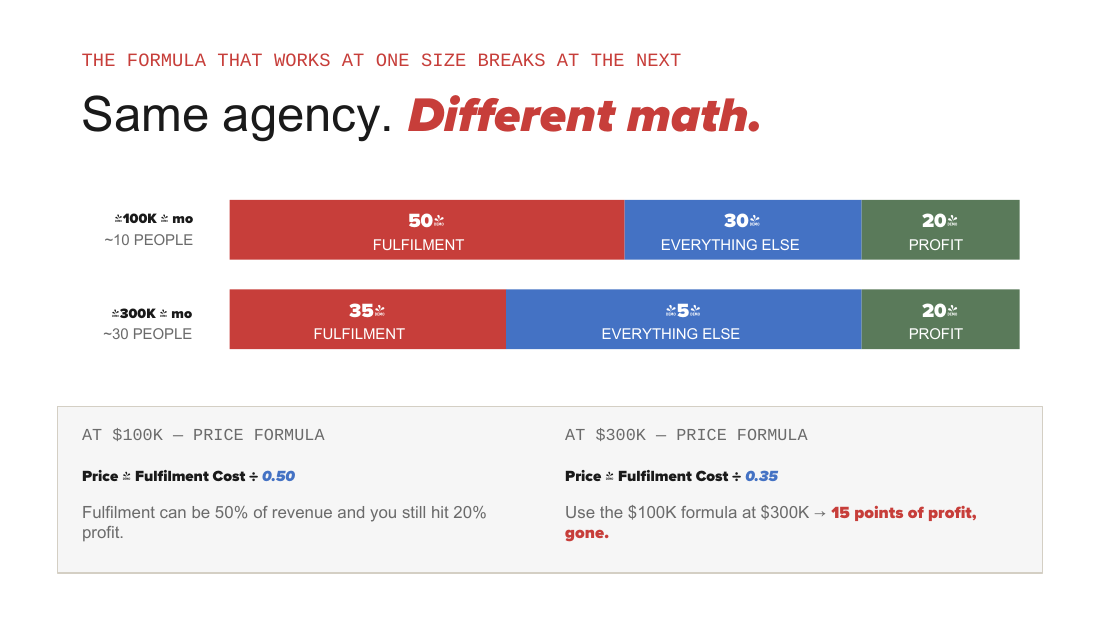
The pricing formula that works at one size breaks at the next. At $100K/month (~10 people) Price = Fulfilment Cost / 0.50. At $300K/month (~30 people) Price = Fulfilment Cost / 0.35, because overhead grows from 30% to 45% of revenue. Using the $100K formula at $300K silently costs 15 points of profit (20% drops to 5%).
-
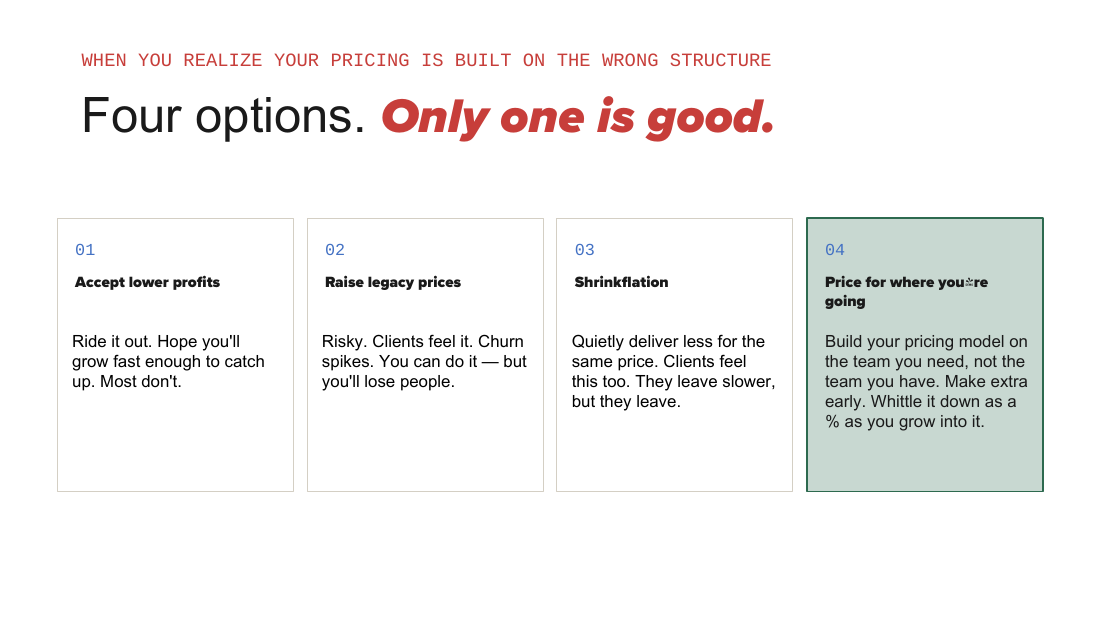
Price for where you are going, not where you are. Of four options (accept lower profit, raise legacy prices, shrinkflation, price for the future team), only pricing for the team you need is good. Kettner's single biggest regret is pricing for the team he had, leaving him fighting legacy pricing drag ten years in.
-
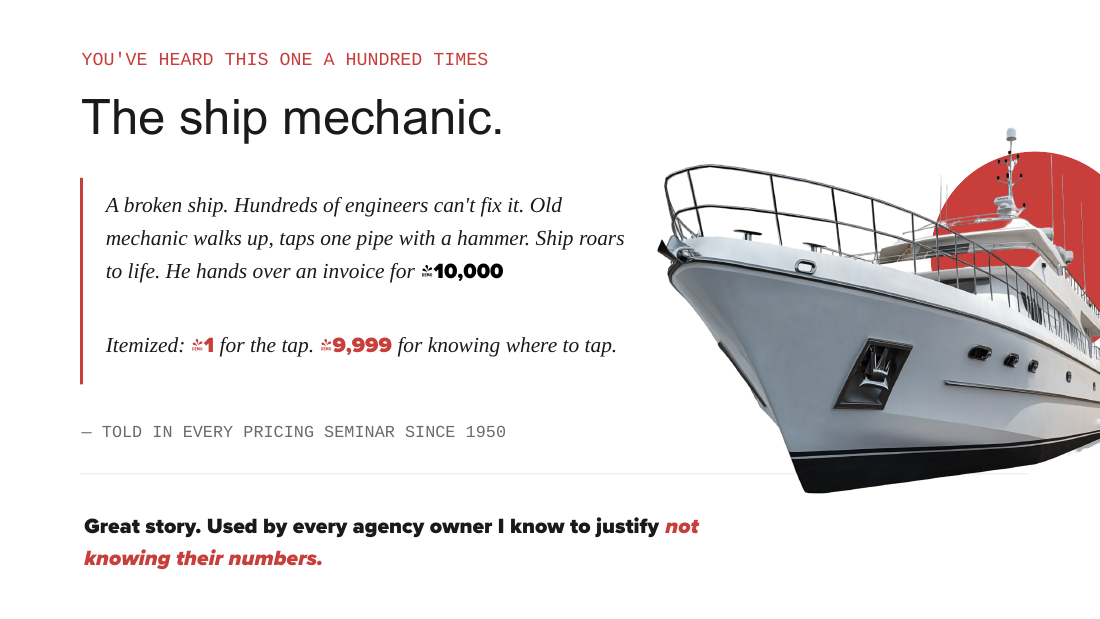
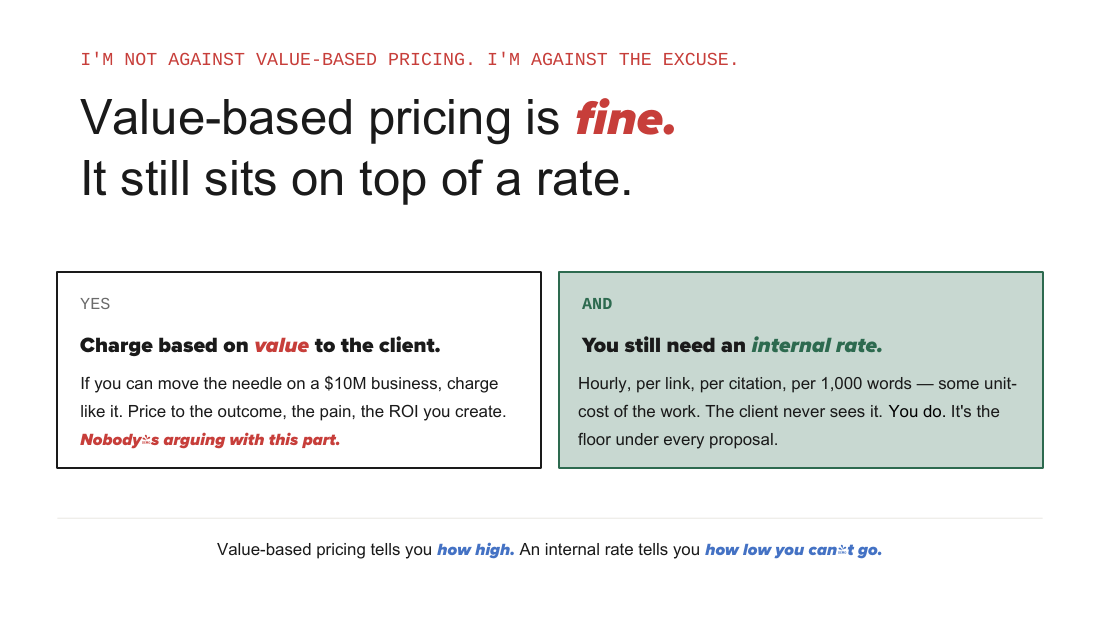
The ship mechanic story is the excuse agencies use to not know their numbers. Value-based pricing is real, but "I charge for value, not hours" is often a story owners tell themselves so they never build the spreadsheet. You still need an internal unit rate (per hour, per link, per citation, per 1,000 words) as the floor under every proposal.
-
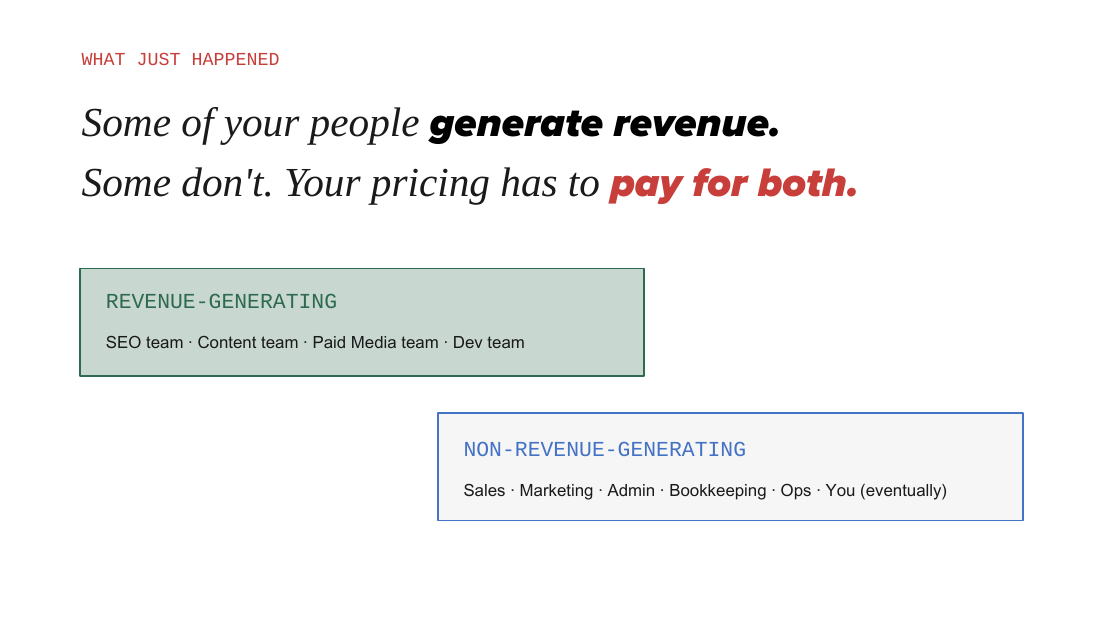
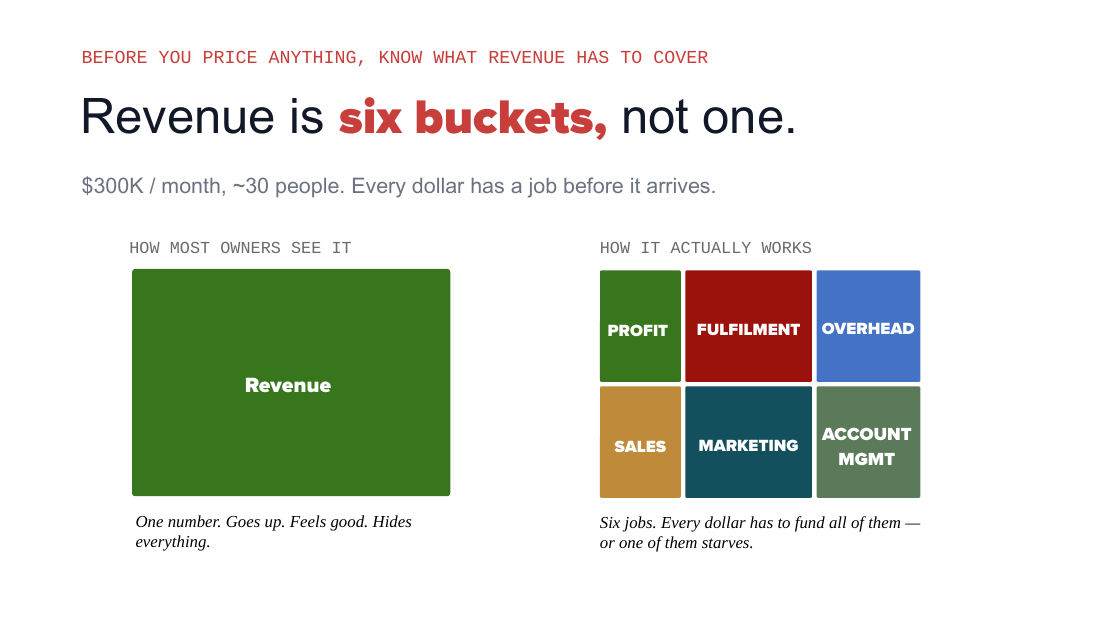
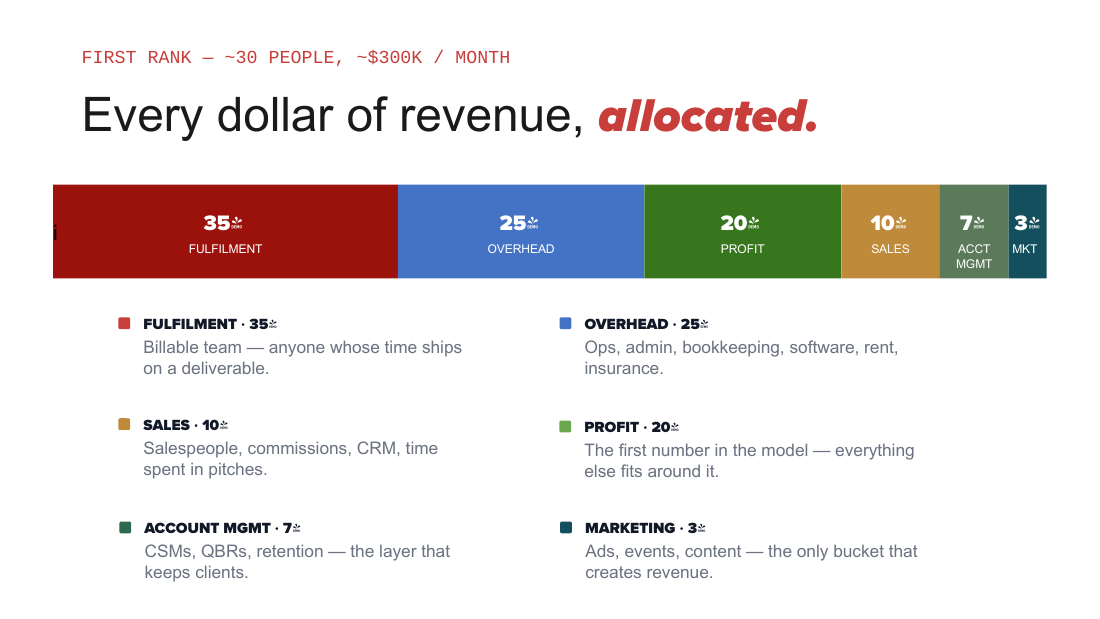
Revenue is six buckets, not one: fulfilment, overhead, sales, marketing, account management, profit. At First Rank's ~$300K/30-person scale the split is 35% fulfilment, 25% overhead, 20% profit, 10% sales, 7% account management, 3% marketing. Profit is the first number you set; everything else fits around it. Every price must pay rent on all six buckets.
-
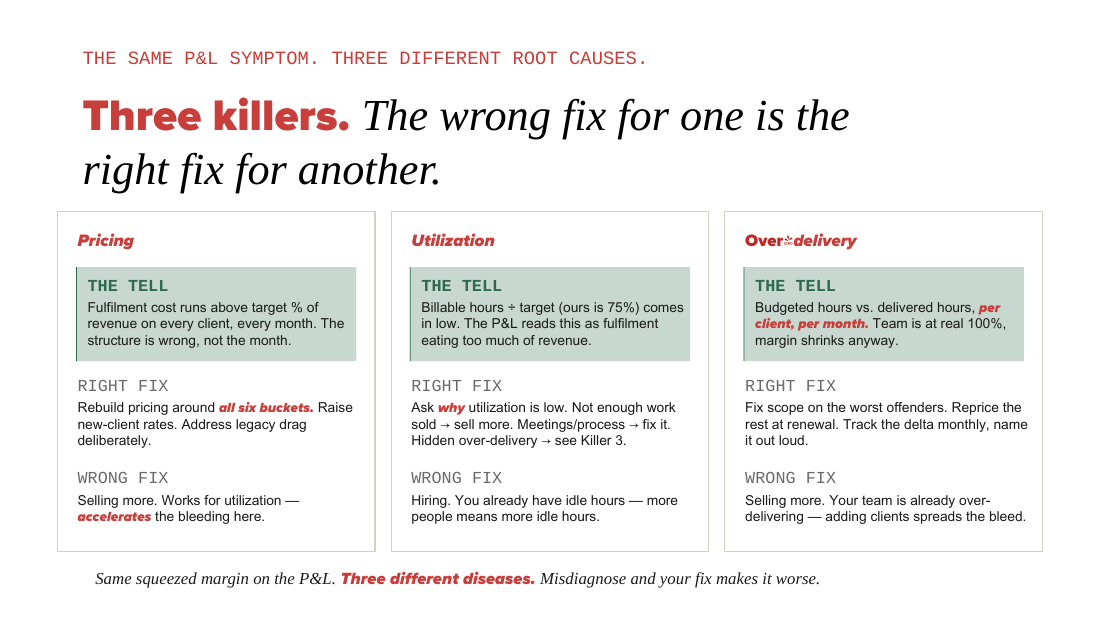
Three killers squeeze margin identically on the P&L but need opposite fixes. Pricing (structure wrong, fix by repricing; selling more makes it worse), utilization (billable hours below target, often fixed by selling more), and over-delivery (delivered hours exceed budgeted hours, fixed by scope and renewal repricing). Misdiagnose and the right fix for one accelerates the bleed of another.
-
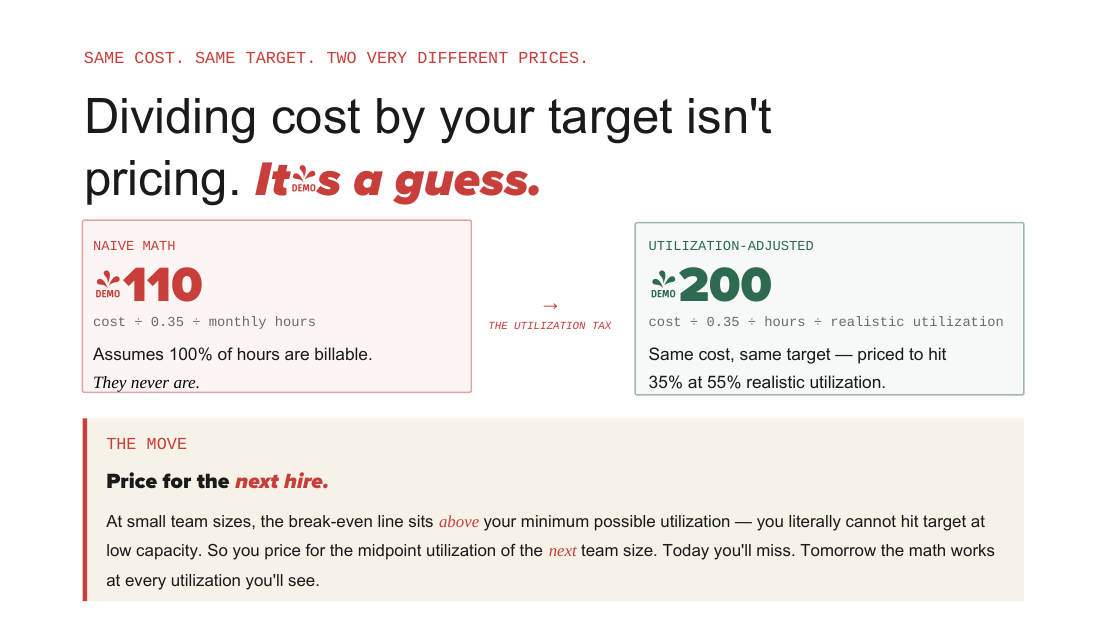
Naive cost-divided-by-target pricing under-prices by nearly half (the utilization tax). Dividing cost by target assumes 100% billable hours, which is physically impossible. Re-dividing by realistic utilization (55% at break-even) moves a $110/hr rate to $200/hr. Small teams cannot price their way out of the red zone, so you price for the midpoint utilization of the next team size up.
-
The model is a leadership instrument, not a finance report. Kettner built it because he could not delegate (trust without measurement is just hope). Every role at First Rank has measurable KPIs so someone else can diagnose and fly the plane. The toolkit ships as five spreadsheets plus INSTRUCTIONS.md and AI_CONTEXT.md to adapt with Claude or ChatGPT.
Key points
Agency profile
- First Rank SEO: 30-person SEO agency in Manitoba, Canada; $3.17M revenue last year; about 97 active clients; 90% monthly recurring revenue.
- Kettner started as an Olive Garden bartender and built the agency from a side hustle.
- Fulfilment models tried in order: VAs overseas, whitelabel partners, freelancers, then an internal team. "Every single transition broke something I thought was working."
- Claim: he knows his numbers to the dollar (cost per department, cost per client, where over-delivering, where under capacity, profit margin by service line).
Solo time allocation
- Typical solo time split: Fulfilment 30%, Sales and outreach 20%, Account management 20%, Admin and bookkeeping 15%, Marketing 15%.
- Every hat is a future cost center; solo fulfilment cost is not zero (it is your time, just not priced separately).
The hiring valley
- Fully loaded cost of one hire: $5,500/month (used consistently throughout the deck).
- Owner lifestyle cost baked in: $15K/month.
- First-hire valley (revenue stays $15K): Solo = $15K revenue, $15K take-home. Valley floor = $15K revenue, $9.5K take-home (a 37% owner pay cut). Break-even = $20.5K revenue, $15K take-home (back to solo level; "the single most important number for anyone who just hired"). Recovery = $27K revenue, $21.5K take-home.
- Time to climb out of one valley: "probably six months, maybe more." Every hire forces another underwater period.
The overhead-hire break
- Hires 1 through 4 are fulfilment hires that recover normally. Between hire 4 and hire 5, one overhead hire steps cost up $5,500 with no new revenue capacity, so every fulfilment hire after it never catches up; the margin baseline shifts down permanently.
- Revenue-generating roles: SEO team, Content team, Paid Media team, Dev team.
- Non-revenue-generating roles: Sales, Marketing, Admin, Bookkeeping, Ops, You (eventually).
Pricing formula by size
- At $100K/month (~10 people): Price = Fulfilment Cost / 0.50. Split 50% fulfilment, 30% everything else, 20% profit. ($500 fulfilment client charged at $1,000.)
- At $300K/month (~30 people): Price = Fulfilment Cost / 0.35. Split 35% fulfilment, 45% everything else, 20% profit. ($500 fulfilment client charged at $1,430.)
- Using the $100K formula at $300K: profit drops from 20% to 5% (15 points gone) with nothing visibly wrong on the surface.
Four options when pricing structure is wrong
- Accept lower profits (ride it out; most do not make it).
- Raise legacy prices (risky; churn spikes; clients feel ambushed).
- Shrinkflation (deliver less for same price; clients leave slower but they leave).
- Price for where you are going (only good option; build pricing on the team you need, make extra early, whittle the percentage down as you grow into it). - Kettner's biggest regret: he priced for the team he had, still fighting legacy pricing drag ten years in.
The ship mechanic and value-based pricing
- The ship mechanic story: invoice $10,000 itemized as $1 for the tap, $9,999 for knowing where to tap. "Told in every pricing seminar since 1950." Kettner's objection: it is used as an excuse to not know your numbers.
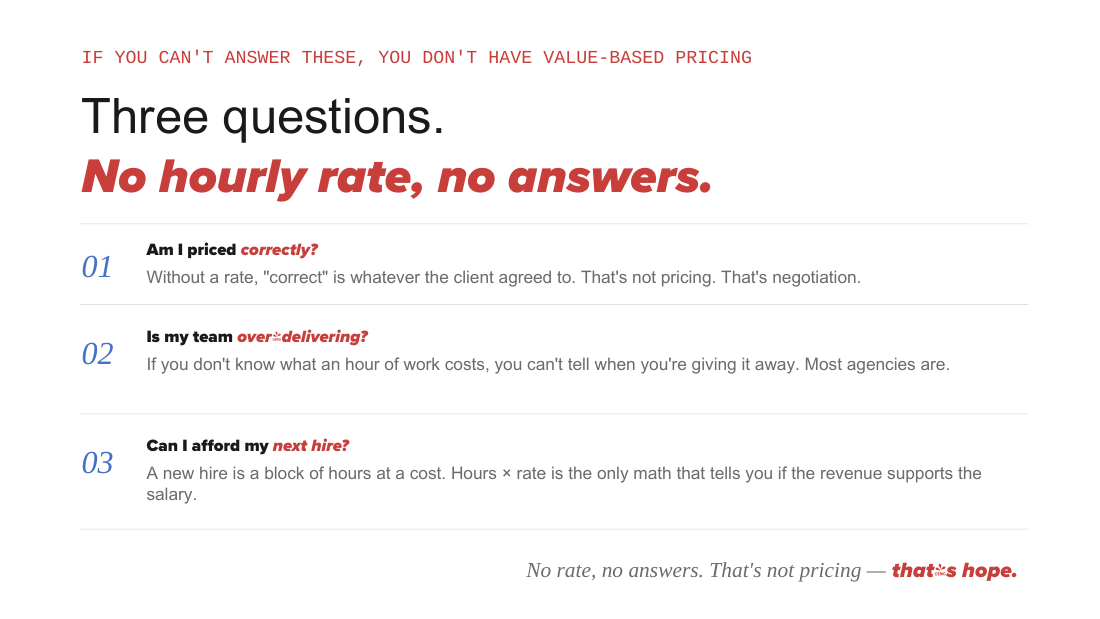
- Three questions you cannot answer without an internal unit rate: Am I priced correctly? Is my team over-delivering? Can I afford my next hire?
- Position: "Value-based pricing tells you how high. An internal rate tells you how low you can't go." Unit rate options: hourly, per link, per citation, per 1,000 words. The client never sees the internal rate.
The six buckets
- Revenue is six buckets, not one: Fulfilment, Overhead, Sales, Marketing, Account Management, Profit. Analogues cited: restaurant "prime cost," manufacturer "cost of goods."
- First Rank model (~30 people, ~$300K/month): Fulfilment 35% (anyone whose time ships on a deliverable); Overhead 25% (ops, admin, bookkeeping, software, rent, insurance); Profit 20% (the first number set; everything fits around it); Sales 10% (salespeople, commissions, CRM, pitches); Account Management 7% (CSMs, QBRs, retention); Marketing 3% (ads, events, content; "the only bucket that creates revenue").
- Honest admission: profit target is 20% but last year was "closer to twelve" (12%). Percentages change with size; the six categories do not.
Pricing rule
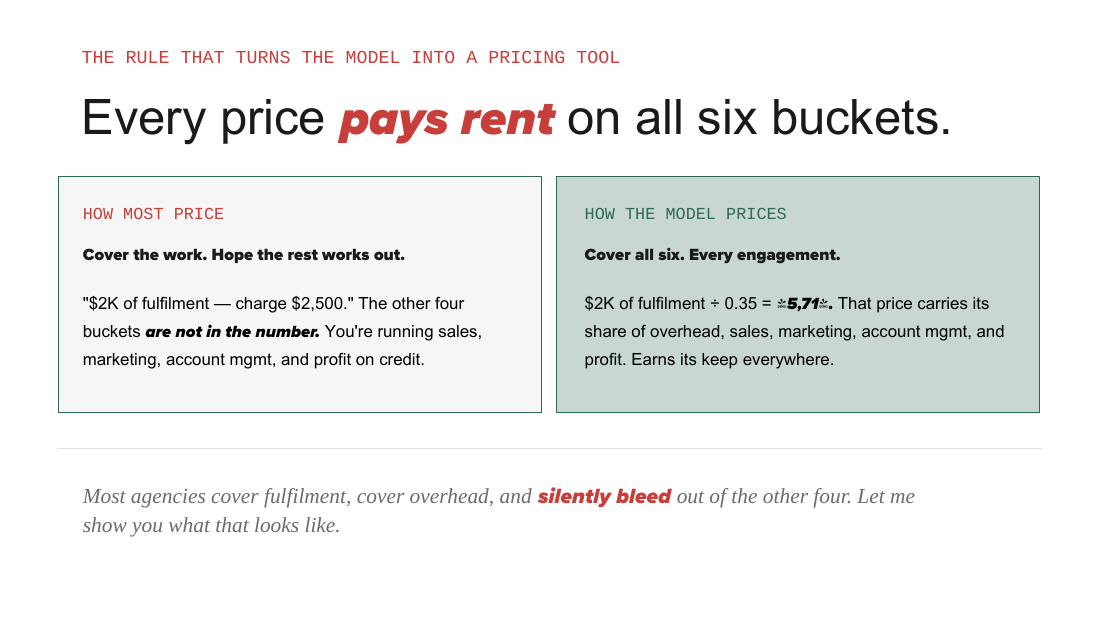
- Every price must "pay rent on all six buckets," not just fulfilment.
- Model example: $2K of fulfilment / 0.35 = $5,714 (not $2,500). Most agencies cover fulfilment and overhead and silently bleed the other four.
Three profit killers
- Killer 1, Pricing. Tell: fulfilment cost runs above target % every client, every month. Right fix: rebuild pricing around all six buckets, raise new-client rates, address legacy drag deliberately. Wrong fix: selling more (accelerates the bleed).
- Killer 2, Utilization. Tell: billable hours / target comes in low (First Rank target 75%). Right fix: ask why (not enough work sold then sell more; meetings/process then fix it; hidden over-delivery then see Killer 3). Wrong fix: hiring (you already have idle hours).
- Killer 3, Over-delivery. Tell: budgeted hours vs delivered hours per client per month; team at real 100% but margin shrinks. Right fix: fix scope on worst offenders, reprice the rest at renewal, track the delta monthly and name it out loud. Wrong fix: selling more.
- Killer 3 can hide inside a Killer 2 reading when over-delivery hours are logged into overhead instead of the client.
Real-world disaster numbers
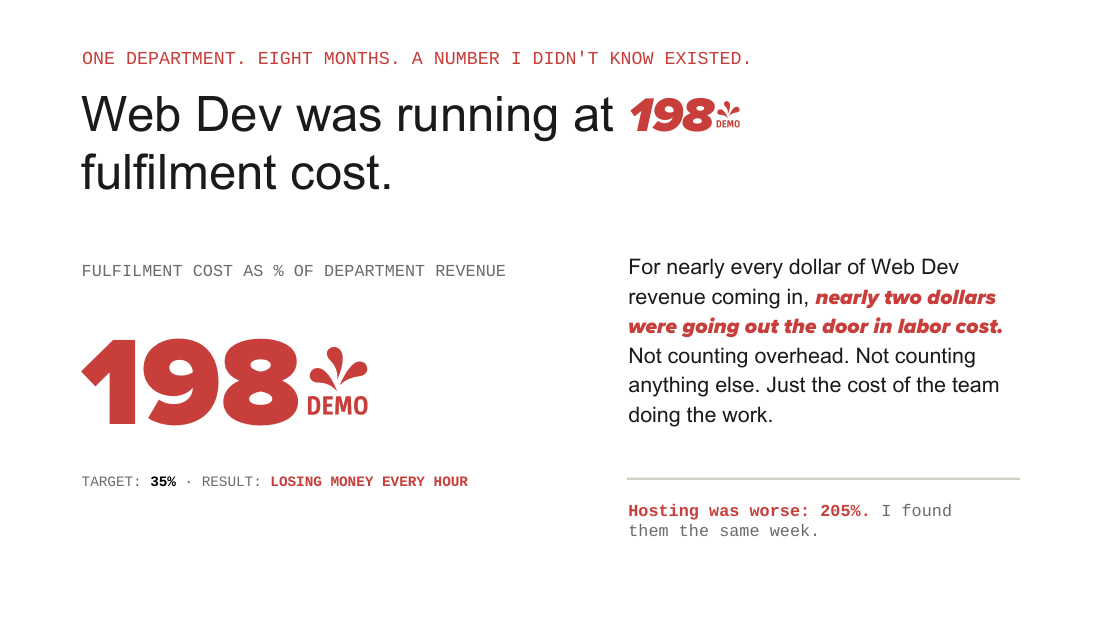
- Web Dev department ran at 198% fulfilment cost (target 35%) for about 8 months (2023 into early 2024). For every $1 of revenue, $1.98 went out in labor (before overhead).
- Hosting department was at 205% fulfilment cost, found the same week.
- Hidden because the healthy SEO department was subsidizing both via the top line. Finding these two numbers is what made Kettner build the first version of the model.
Utilization tax and small-team math
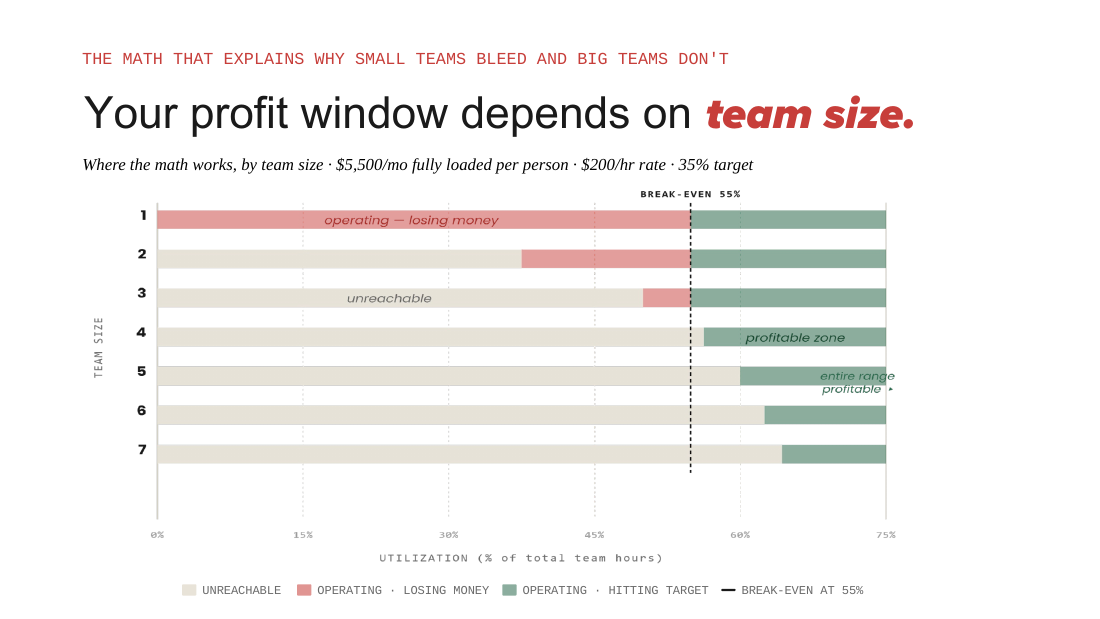
- Chart assumptions: $5,500/month fully loaded per person, $200/hr rate, 35% target. Break-even utilization = 55%.
- Team-size effect: a 1-person team has no floor (red below 55%). A 2-person team's minimum utilization is 38%, giving a 17-point window where you operate but lose money. As teams grow, minimum realistic utilization eventually clears 55%. A 7-person team has an 11-point window but every point is green.
- Insight: big teams are profitable not because break-even is lower (it is the same 55%) but because their minimum realistic utilization finally clears the line.
- Naive math: cost / 0.35 / monthly hours assumes 100% billable, yields about $110/hr. Utilization-adjusted: cost / 0.35 / hours / realistic utilization (55%) yields $200/hr. The ~$90 gap is the "utilization tax."
- First Rank target utilization is 75% (and they miss it some months).
- "Price for the next hire": Paid Media is a 2-person team; pricing for 35% at its real minimum would require over $600/hr (a fantasy), so it is priced at $200/hr, which works at the midpoint of a 3-person team. The 7-person SEO group was priced for 35% at minimum utilization (no faith required). Both constraints must be true at once: the cost-center split AND realistic utilization.
The leadership reframe
- "You can't delegate what you can't measure."
- The first operations lead (name not given, female) held the company together with judgment, not KPIs; when she left, Kettner learned "trust without measurement is just hope."
- Kiara runs operations now, came up from entry level, measured on real numbers (fulfilment cost %, utilization by department, over-delivery by client) and diagnoses misses herself because she has the same model.
- Every role has measurable KPIs: pod leads have retention numbers, strategists have delivery-vs-budget numbers, sales has conversion rates and pipeline velocity. "The model is the instrument panel. The point is that somebody else can fly the plane."
The toolkit architecture
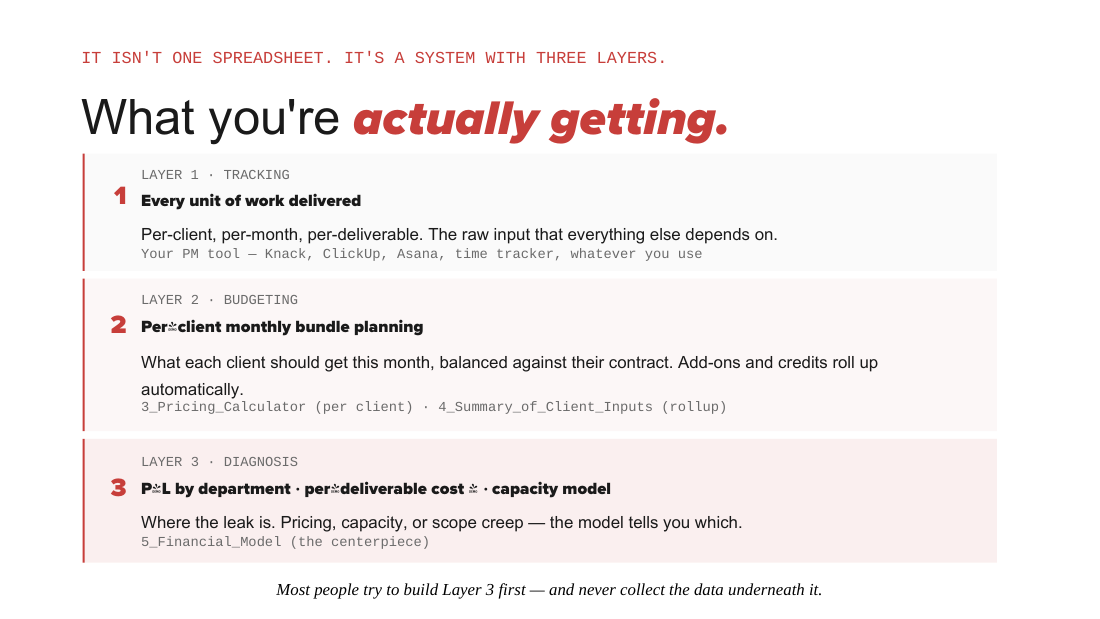
- Three layers. Layer 1, Tracking: every unit of work delivered, per client/month/deliverable; lives in your PM tool (First Rank uses Knack; alternatives ClickUp, Asana, a time tracker, or a Google Sheet); not included in the packet. Layer 2, Budgeting: per-client monthly bundle planning (files 3_Pricing_Calculator and 4_Summary_of_Client_Inputs); CSM-facing. Layer 3, Diagnosis: P&L by department, per-deliverable cost %, capacity model (file 5_Financial_Model, the centerpiece); reviewed every Monday morning.
- Caution: most owners try to build Layer 3 first and never collect the data underneath. Start at Layer 2.
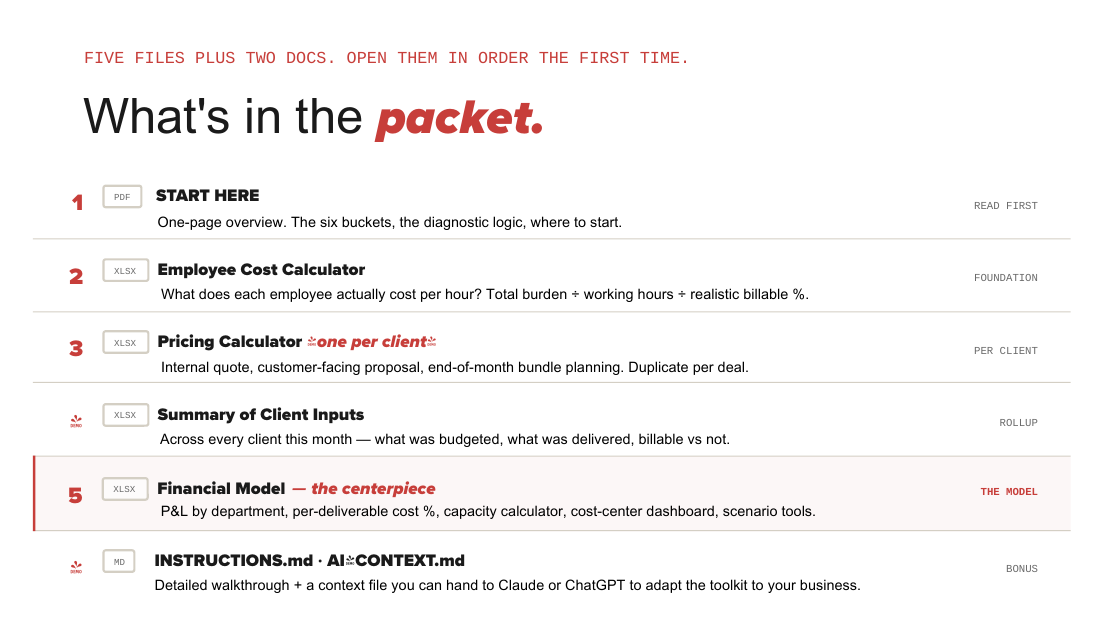
- Packet contents: five spreadsheets plus two docs. (1) START HERE PDF (one-page overview; read first). (2) Employee Cost Calculator (XLSX, foundation): total burden / working hours / realistic billable %. (3) Pricing Calculator (XLSX, one per client): internal quote, customer-facing proposal, end-of-month bundle planning. (4) Summary of Client Inputs (XLSX, rollup): budgeted vs delivered, billable vs non-billable across all clients. (5) Financial Model (XLSX, the centerpiece): eight tabs, twelve months; P&L by department, per-deliverable cost %, capacity calculator, cost-center dashboard, scenario tools.
- Bonus: INSTRUCTIONS.md and AI_CONTEXT.md (hand AI_CONTEXT.md to Claude or ChatGPT to adapt the toolkit). Delivered via a QR code in the live deck (download URL not given in the deck text).
Three sample views from the model
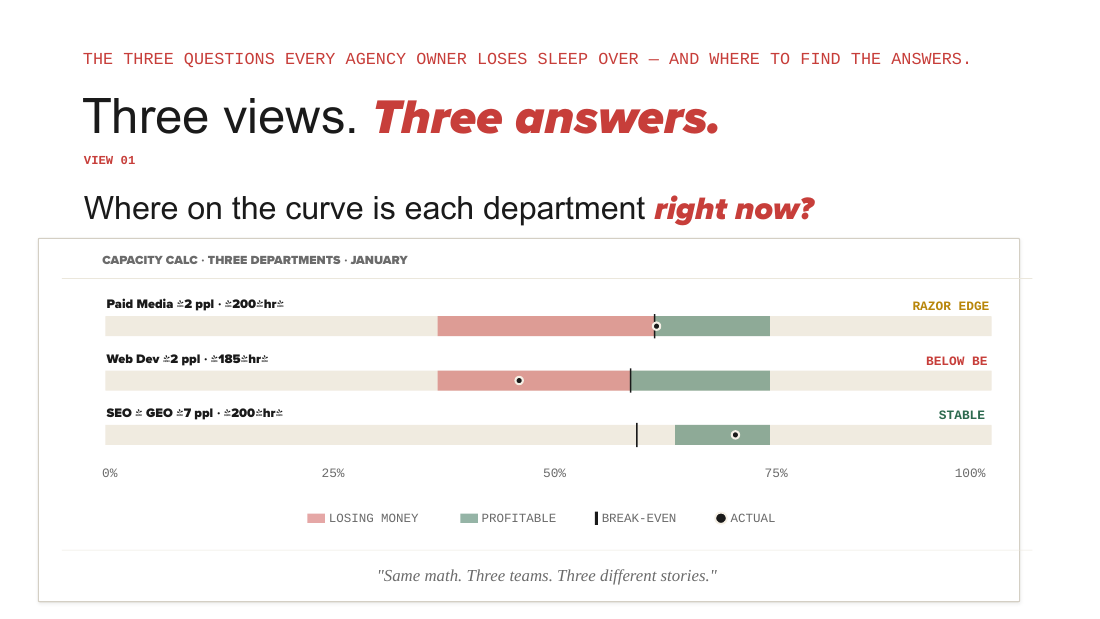
- View 01, Capacity Calc (January sample data): Paid Media (2 people, $200/hr) sitting right on break-even (razor's edge); Web Dev (2 people, $185/hr) below break-even (losing money every hour); SEO/GEO (7 people, $200/hr) in a stable state, minimum possible utilization 64% (above break-even), every position profitable.
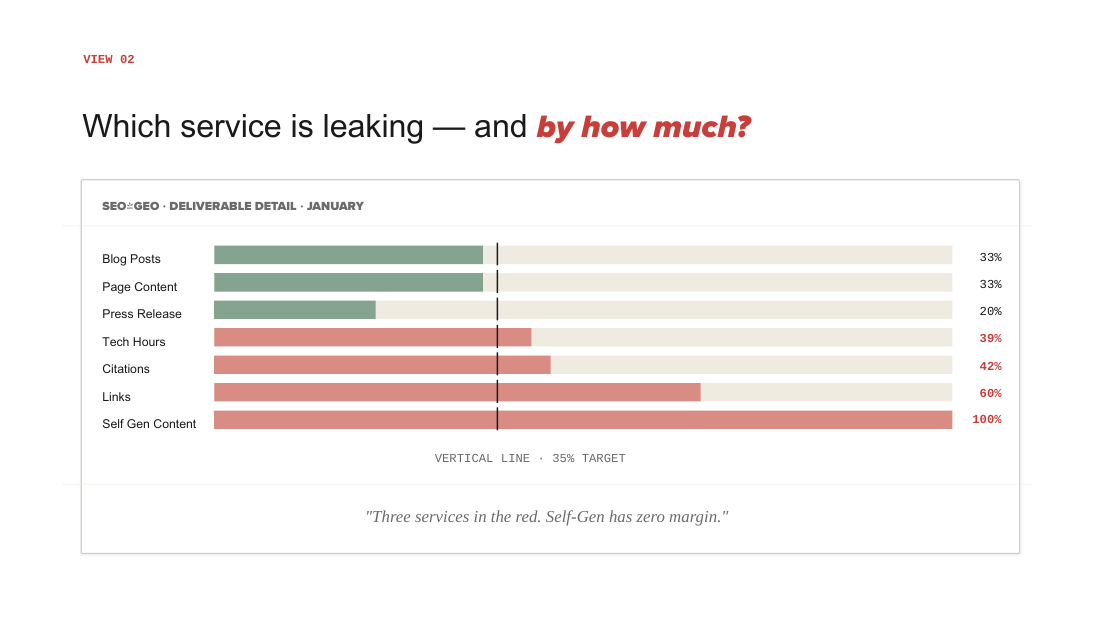
- View 02, Deliverable Detail (SEO-GEO, January) vs the 35% target line: Blog Posts 33%, Page Content 33%, Press Release 20% (under target, healthy); Tech Hours 39%, Citations 42%, Links 60%, Self Gen Content 100% (zero margin) over target. "Three services in the red."
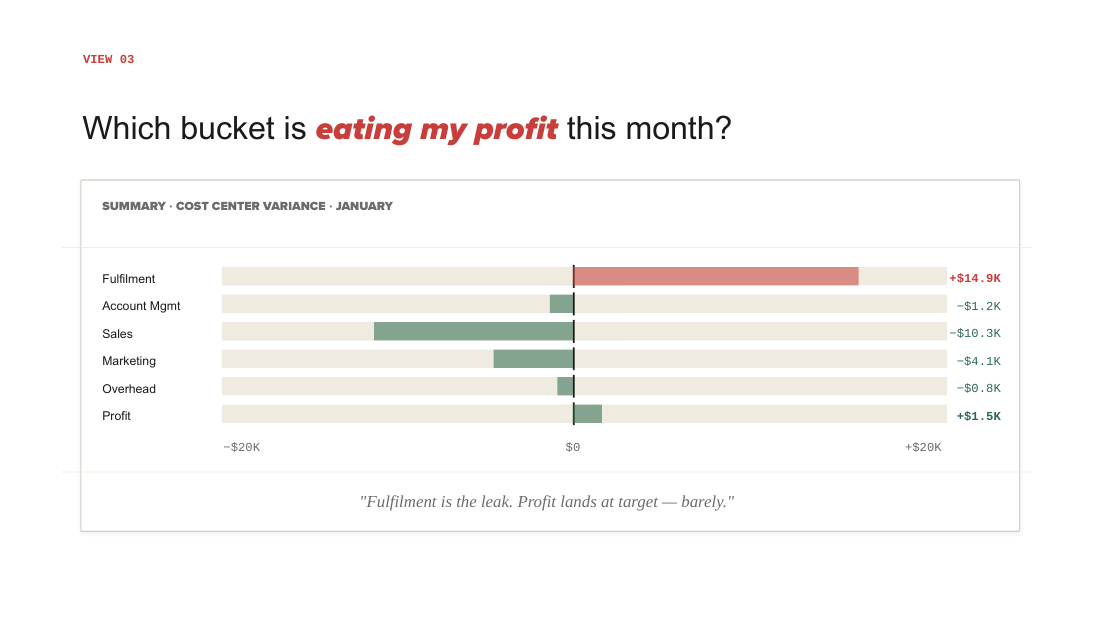
- View 03, Cost Center Variance (Summary, January) vs target: Fulfilment +$14.9K (the leak), Account Mgmt -$1.2K, Sales -$10.3K, Marketing -$4.1K, Overhead -$0.8K, Profit +$1.5K ("at target, barely"). Monday framing: not "how was January?" but "Fulfilment is fifteen K over, walk me through the deliverable detail. Show me Self Gen."
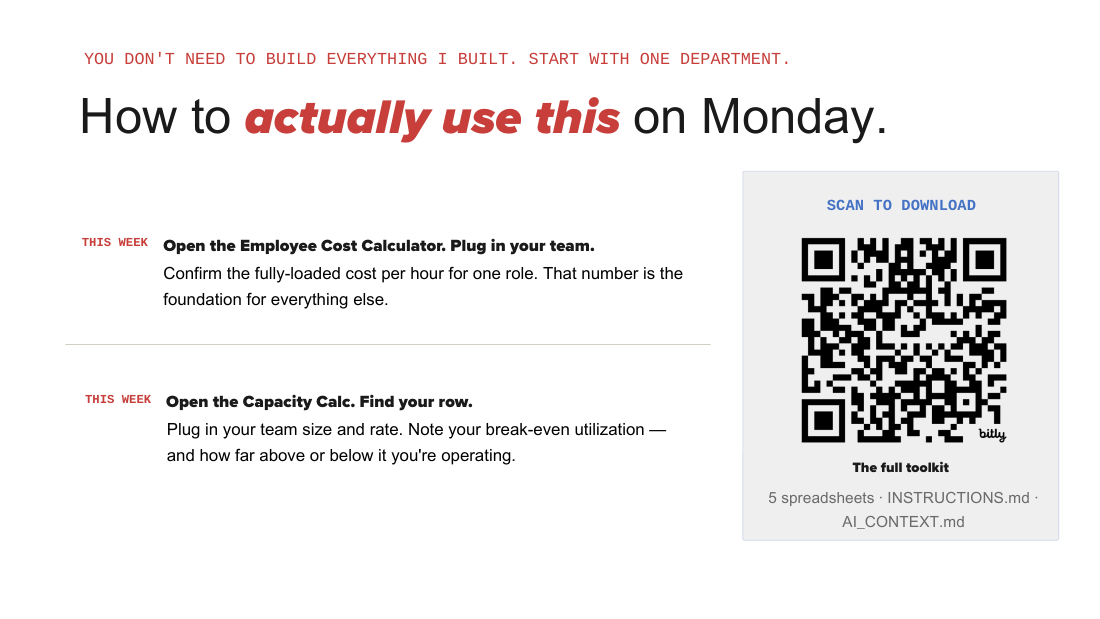
Implementation order
- This week: open the Employee Cost Calculator and confirm fully-loaded cost per hour for one role. Open the Capacity Calc, find your row, note your break-even utilization, and see whether you are above or below it.
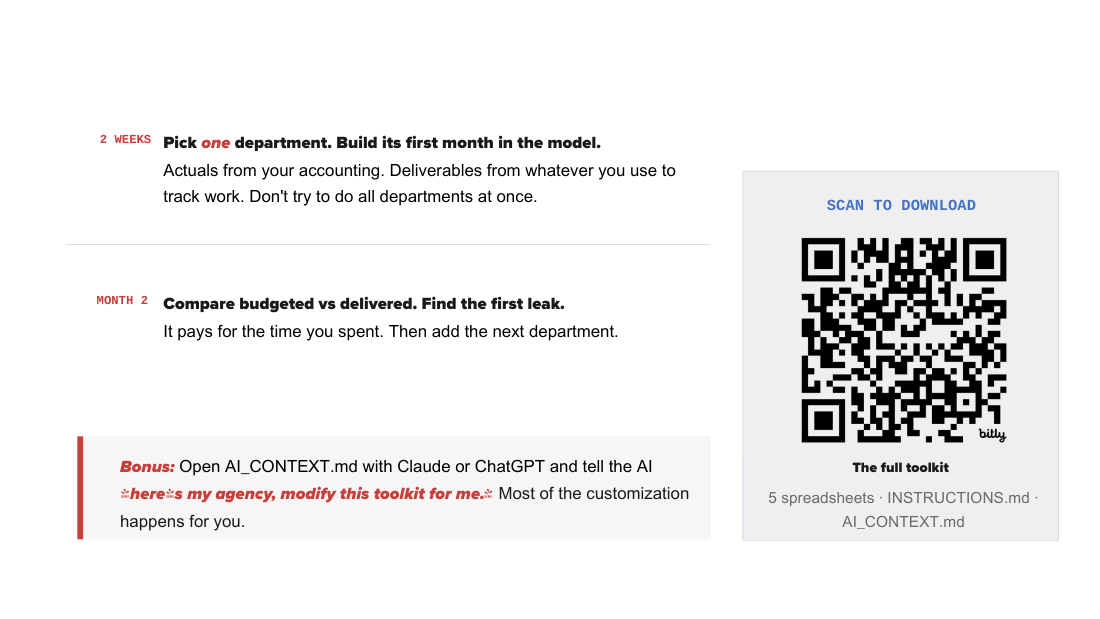
- Within 2 weeks: pick one department (the one bothering you most) and build its first month in the Financial Model.
- Month 2: compare budgeted vs delivered and find the first leak ("the first leak you find pays for the time you spent"); then add the next department.
- Bonus: open AI_CONTEXT.md with Claude or ChatGPT and tell it "here's my agency, modify this toolkit for me."
- Close: "Good agencies fail when they fly blind. Build the instruments. Then somebody else can fly the plane." (Firstrank.ca.)
Slides
Slides (28)

Source
Synthesized from the conference deck for Jacob Kettner's session "Why Good Agencies Fail" (deck file jacob-kettner-why-good-agencies-fail, First Rank SEO). This was a deck-only session with no recording. The toolkit download URL is delivered via a QR code in the live deck and is not in the deck text. The first operations lead's name and Kiara's surname are not given in the source.